The main go-to for monitoring seem to be using Prometheus and Grafana these days, and both are great at what they do. I’m using Prometheus myself - primarily for alerting - and it is amazing!
While I use Prometheus for alerting, most of my long-term metrics end up in Munin instead. Munin is a lot less “fancy” than Grafana, but you could equally say that it is a lot simpler than Grafana. The Munin Wikipedia page has a lot more information on it.
At its core, Munin is a collection of cronjobs that will connect to Munin
nodes (usually you have one Munin node installed on each server) and, from
within the connection, run Munin plugins. Those plugins usually have two
functions, one is to print configuration for the data and graph (types,
description, minimum and maximum value, …) and another just prints the
values. For this, munin uses an extremely simple line-based protocol. It looks
like this (< means “incoming”, > means “outgoing”):
$ nc localhost 4949
< # munin node at example.com
> list
< cpu df df_inode entropy fail2ban forks fw_conntrack fw_forwarded_local fw_packets http_loadtime if_err_eth0 if_eth0 interrupts irqstats load memory munin_stats open_files open_inodes postfix_mailqueue postfix_mailvolume postgres_autovacuum postgres_connections_ALL postgres_users postgres_xlog proc_pri processes swap threads uptime users vmstat
> config threads
< graph_title Number of threads
< graph_vlabel number of threads
< graph_category processes
< graph_info This graph shows the number of threads.
< threads.label threads
< threads.info The current number of threads.
< .
> fetch threads
< threads.value 278
< .
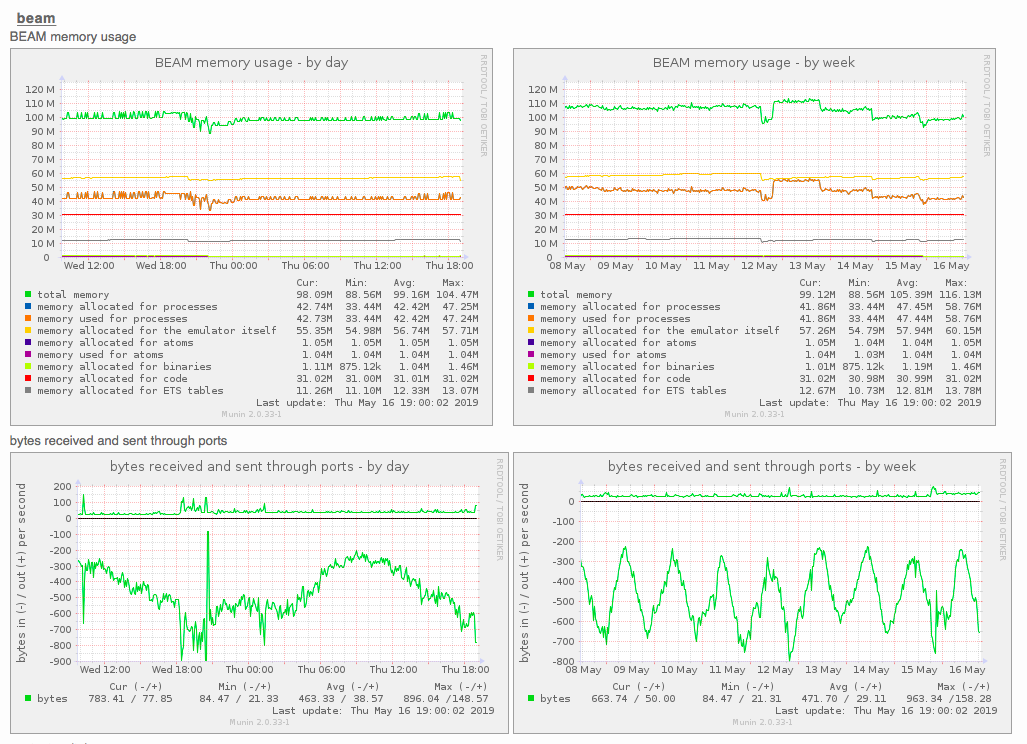
Perfectly human-readable. And trivial to implement as well. For example, I have written an Elixir library that implements the above protocol and allows you to export data about your Erlang virtual machine. The resulting graphs that the Munin master will generate look like this:
You don’t need to run a HTTP server that speaks Prometheus-formatted metrics1, you just need to run anything that speaks that simple line-based TCP protocol above.
munin generates graphs using RRDtool (wiki), which is interestingly enough a lot more efficient than the (much newer) Grafana’s image PNG renderer, most likely because it’s a C binary and not a JavaScript tool that spawns a web browser to take a screenshot of a web site that contains the JS-generated graph. But I digress.
A fun feature of this is that it gives you a year of stats in its default configuration, usually in a quick-to-scan view, making it easy to see any oddities. RRDtool is very efficient in storing these and I really recommend learning how to work with it, at its core it’s a wonderful file-based time series database that you can script easily!
Installation
How do you install it? On the desired munin master (the host that collects and displays graphs):
- You run your distribution’s equivalent of
apt install munin. - You configure it in
/etc/munin/munin.confor/etc/munin/munin-conf.d/my-custom.conf. - You configure your webserver. For most usecases any static file server will do.
On the munin nodes, usually your distribution’s equivalent to apt install munin-node is sufficient to install a node and configure any example plugins:
munin ships with plenty out of the box that require 0 configuration from you.
Writing plugins
Most Munin plugins end up in /etc/munin/plugins/, where they are picked up
automatically by munin-node. Anything executable in here will do. Munin
expects the plugin to do two things: if you run it with the argument config,
it prints configuration information, and if you run it with no arguments, it
prints the data it wants to be collected and graphed - see Writing a munin
plugin for
more information.
I want to showcase an example. I have a bunch of
Sieve
scripts to filter my e-mail. For instance, any dependabot e-mail is
automatically marked as seen and trashed2. I figured it would be
fun to see my trash mailbox grow over time and so the following script was
born:
#!/bin/bash
# -*- sh -*-


BASEPATH="${basepath:-/var/vmail}"
FOLDERS="${folders:-"Archive Sent Drafts Junk Trash"}"
FILENAME_DOMAIN="${0##*/maildir_messages_}"
DOMAIN="${domain:-$FILENAME_DOMAIN}"
USERNAME="${username?The 'username' option must be set}"
USERPATH="${BASEPATH}/${DOMAIN}/${USERNAME}/Maildir"

case $1 in
    autoconf|detect)
            echo "no"
            exit 0
	   ;;
    config)
        cat <<EOF
graph_title Maildir mails on ${DOMAIN} for ${USERNAME}
graph_args -l 0
graph_order archive sent inbox drafts junk trash
graph_vlabel Mails
graph_category mail
graph_total Total
inbox.min 0
inbox.label Inbox
inbox.draw AREASTACK
EOF
	for item in $FOLDERS; do
		lower_item="${item,,}"
		cat <<EOF
${lower_item}.min 0
${lower_item}.label ${item}
${lower_item}.draw AREASTACK
EOF
	done
        exit 0
	;;
esac

cd "$USERPATH" >/dev/null 2>/dev/null || {
     echo "# Cannot cd to $USERPATH"
     exit 1
}

echo "inbox.value $( ls "${USERPATH}/cur" "${USERPATH}/new" | wc -l )"
for folder in $FOLDERS; do
	folderpath="${USERPATH}/.${folder}"
	echo "${folder,,}.value $( ls "${folderpath}/cur" "${folderpath}/new" | wc -l)"
done

# vim: set ft=bash:
Chuck that into /etc/munin/plugins and add configuration to e.g.
/etc/munin/plugin-conf.d/maildir_messages like this:
[maildir_messages_yourname]
user vmail
env.username yourname
env.domain example.com
and voila, mailbox monitoring!
-
In all fairness, the Prometheus
node-exporterhas a textfile collector that can read Prometheus metrics from e.g./var/lib/prometheus/node-exporter/., ↩︎ -
I just get too many. Aside from that, the open source developers I’m involved with are almost always two steps ahead of me and already merged the changes in question! ↩︎